Redesigning the Project Timeline
April 2024
Asana’s Timeline view could show dependencies, critical paths, a whole project at a glance. People set one up, glanced at it, and never opened it again.
Where the work happened — three months, on and off Figma.
The problem
Timeline was one of the most differentiated views in Asana — a Gantt-style planning surface meant to be a project manager’s home base. List dominated. Board came second. Timeline sat behind even Calendar.
A 71% drop-off between someone’s first Timeline open and their second, inside two weeks. Most teams set one up during project kickoff, looked at it for thirty seconds, and never came back. That mattered — Timeline was where Asana’s whole “see how the work connects” promise was supposed to come alive. If it didn’t earn a second look, dependencies and critical paths never got a chance either.
Living inside the feature
Before Figma, I ran three real projects in Timeline only, for a full week — a content schedule, a hiring pipeline, a launch plan with three workstreams converging on one date. No falling back to List. I logged every moment I got stuck or lost my place. Two other designers did the same. Between us: 39 friction points.
A funnel analysis with the PM and researcher confirmed the shape of it — Discovery → First open → First edit → Dependency creation → Repeat use. The cliffs were exactly where the dogfooding log said they’d be. Then 18 interviews, asking people to open one of their real projects and walk me through what they saw.
“I open this and my eyes just… slide off. I don’t know where to start looking.”
That was a project manager, four minutes into a fifteen-minute session, staring at a Timeline she’d built herself and couldn’t read.

The dogfooding log — 39 friction points across three designers, including things no dashboard would show: how often you lose your place, how often you give up and switch back to List.
What broke trust
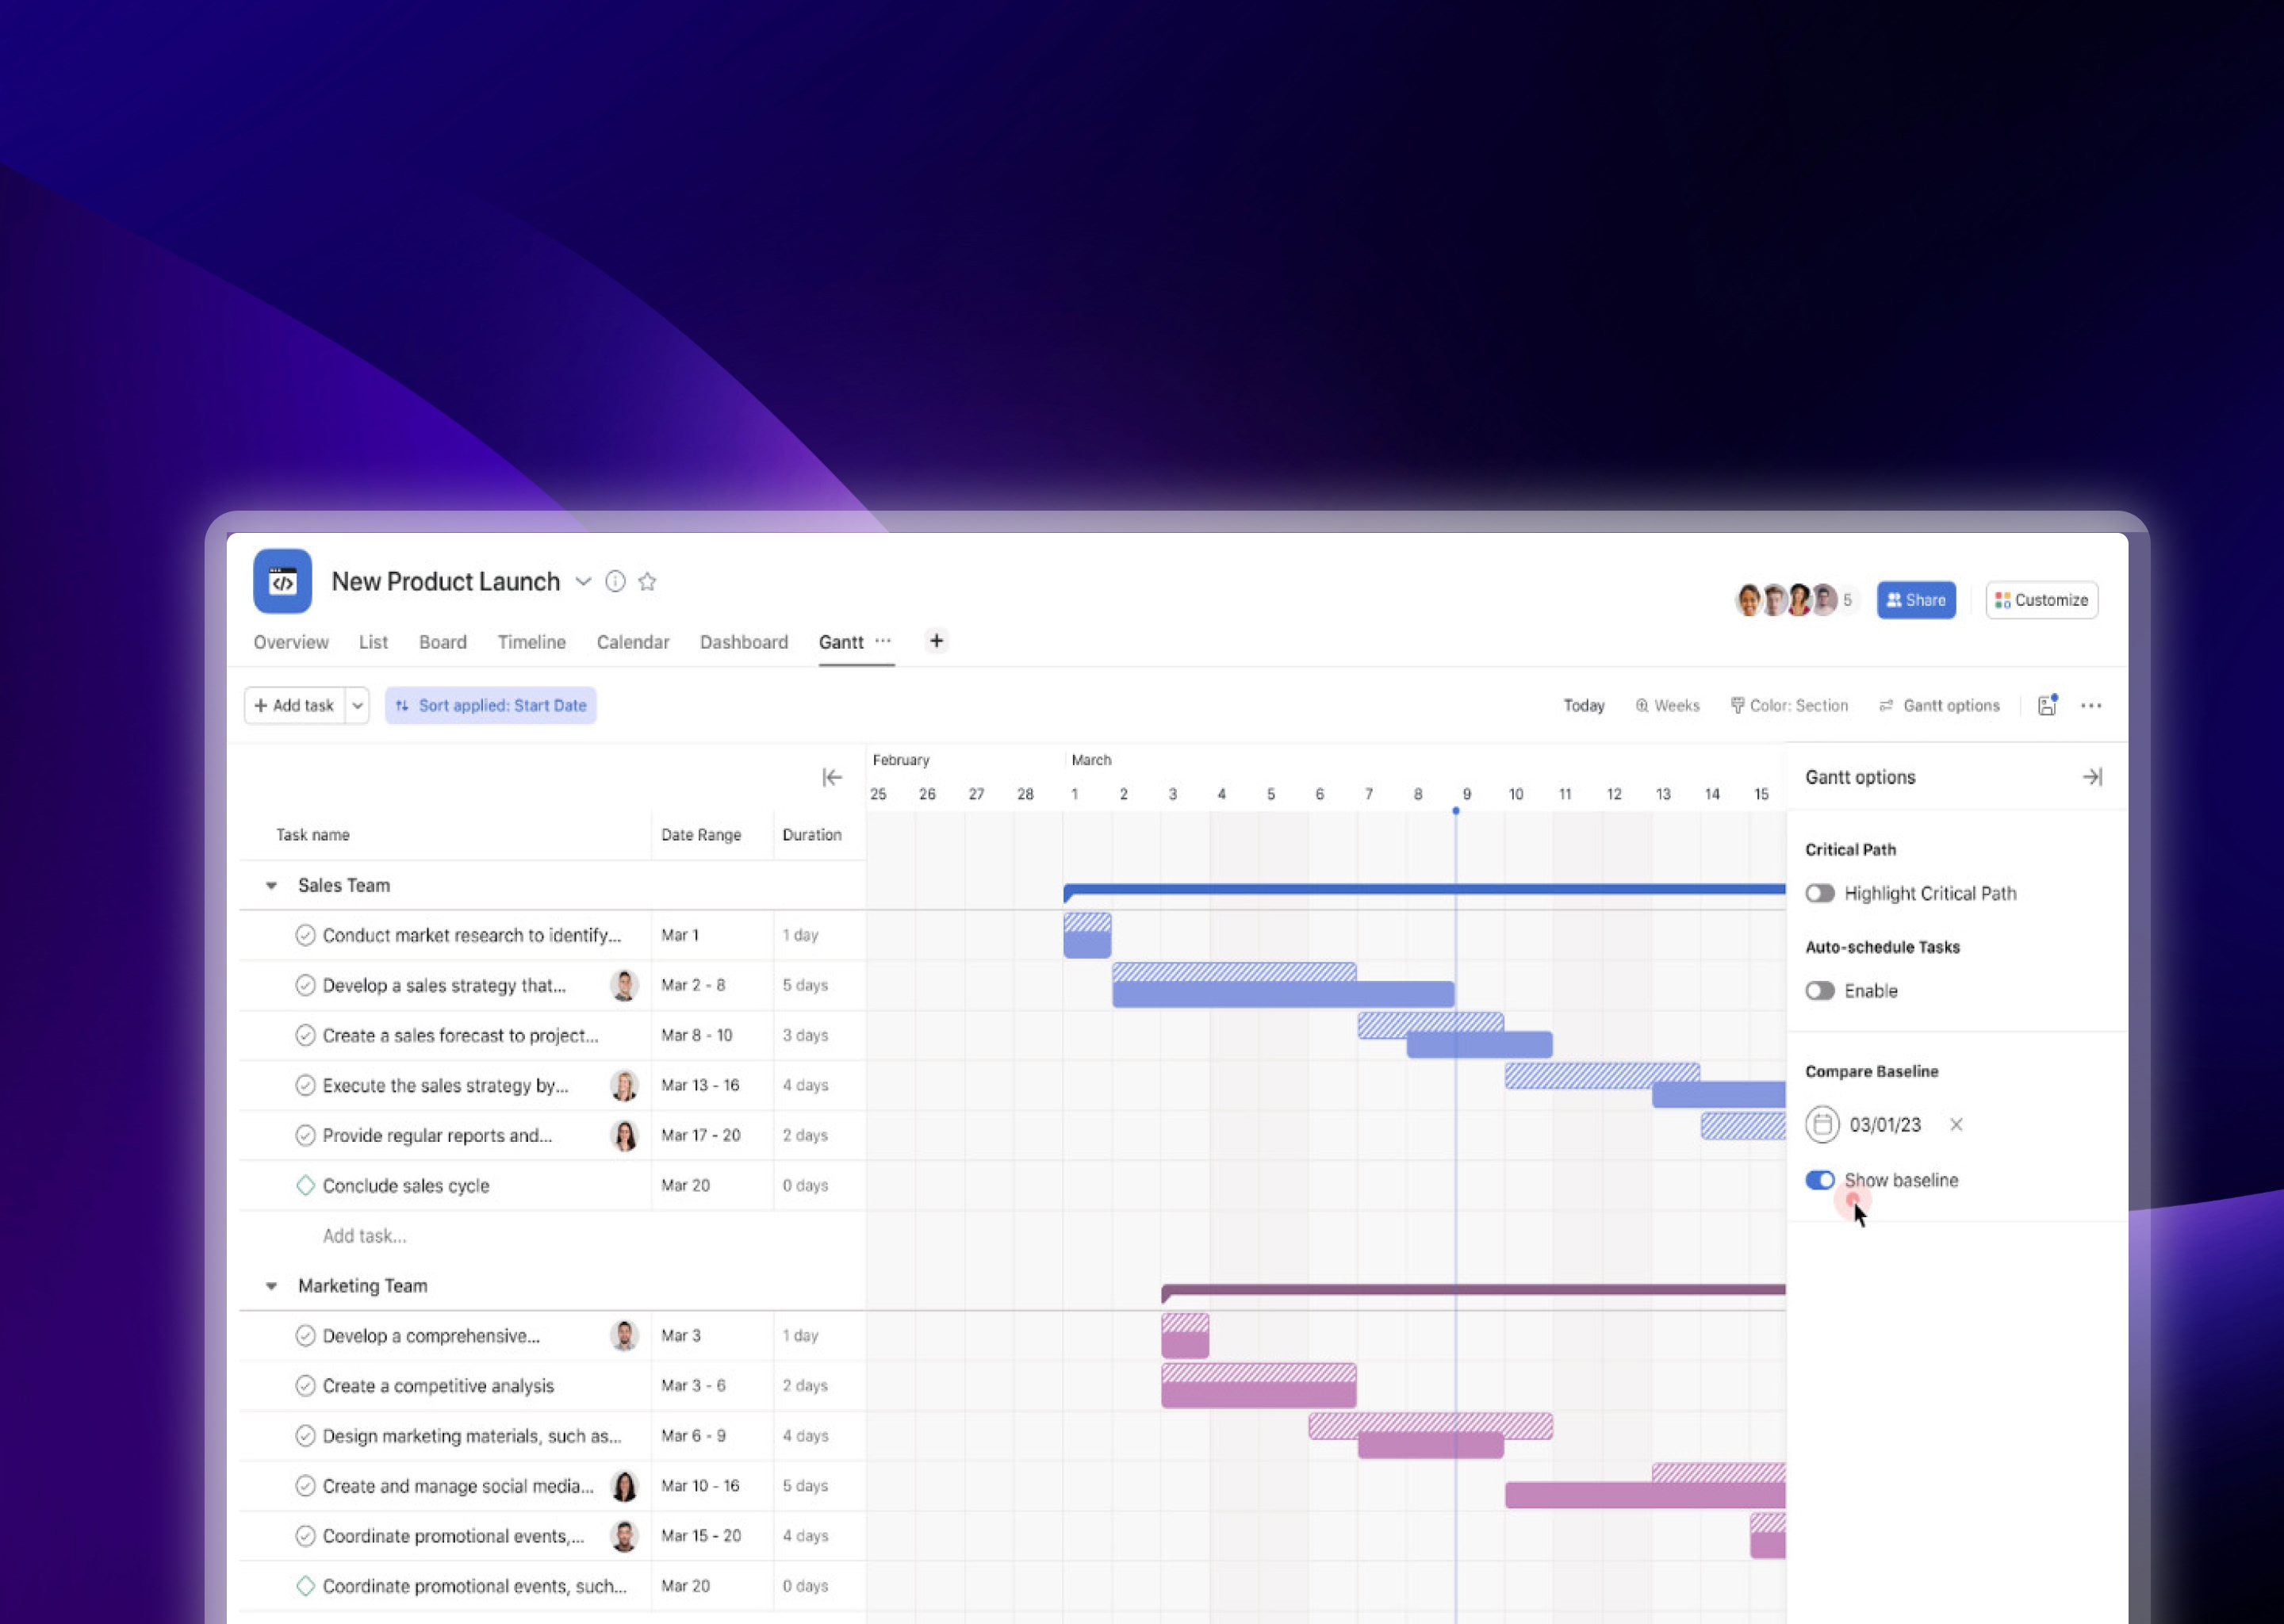
Every bar looked the same. A two-hour review and a six-week build had identical visual weight. Color was tied to assignee, not status — an 80-task Timeline looked like a confetti explosion, and people had to read every bar to understand anything.
Dependencies were invisible until you knew to look for them. Thin gray arrows disappeared into a dense project, and there was no way to isolate the critical path. The one thing Timeline could tell you — if this slips, here’s what else slips — was buried. Once a deadline slipped from a dependency someone missed, they stopped trusting the view entirely. This was the real damage.
Editing felt destructive. Dragging a bar to extend it silently shifted every downstream task, with no preview and no warning. People dragged once by accident, hit undo, and never touched a bar again — doing all their real editing back in the task panel instead.
Four bets
A two-day sprint with the PM, EM, engineers, and researcher turned the friction points into four bets: build visual hierarchy into the bars themselves, make dependencies and the critical path first-class, protect people from edits that felt destructive, and give the Timeline a sense of place — a sticky “today” marker, saved zoom level, collapsible swimlanes, visible filtering.
Four prototypes, tested with seven people. The critical-path toggle won by a wide margin— every tester said some version of “I would actually use this on Monday.”

Two days, one whiteboard, four bets — the framing question was what a project manager needs to read a Timeline in under ten seconds.
What shipped
The bar system got rebuilt around status as the primary signal — calm blue for on track, amber for at risk, red for blocked, a muted checkmark fill for done. Milestones became diamond markers instead of spanning bars, and parent tasks visually roll up child status.
Status became the primary signal on every bar — readable before you read a single label.
A toggle in the header now lights up the critical path and fades everything else back; clicking any task shows what depends on it. Dragging a bar previews every downstream task it will move — “this will reschedule 8 tasks” — before you commit, with one-keystroke undo. And the Timeline now remembers where you were: a sticky today marker, a zoom level that persists per project, and swimlanes that stay collapsed.

Before/after: status-driven color replaced assignee-driven color as the primary signal. Project managers could finally scan.
What changed
Weekly active usage of Timeline rose 53%. People who opened it in their first project were 1.9 times more likely to still be around at 30 days, and correctly spotting at-risk work in under ten seconds rose 44% in testing. Support tickets fell 37%, dependency creation rose 58%, and direct edits on the bars themselves rose 81% — people finally trusted the drag handle.
“I used to plan in Timeline and then live in List. Now I just live in Timeline.”
That, from a customer four months into the new view, is the whole project in one line. Timeline was always powerful. We just hadn’t made it readable, safe to edit, or worth coming back to on a normal Tuesday.
Reflections
Power features fail on legibility, not capability. Timeline had every feature a project manager could ask for. It failed because people couldn’t read it in ten seconds. Once status became the primary signal, every other feature got more valuable.
Dogfooding catches what analytics can’t. “I lose my place when I scroll” was invisible in the funnel data. It only showed up when I used Timeline for a week of real work.
Trust was the real metric. Adoption was the headline, but the deeper win was project managers treating Timeline as their home view, not a meeting-time artifact. A planning tool you don’t trust to edit isn’t a planning tool — it’s a screenshot.